Digital Earth Australia Hotspots - Help
Digital Earth Australia Hotspots - Help
Table of Contents
About
Digital Earth Australia Hotspots is an online map-based tool created by the Australian Government that provides important information about potential active bushfires, or hotspots, to emergency service managers and the general public through the use of satellite imagery on a daily basis. This application also aids the public in monitoring possible bushfire threats affecting their homes or property. Additionally, the application also provides industry with valuable and timely information regarding possible bushfire threats.
Toolbar and Operations on the Portal
Frequently Asked Questions
What is a hotspot?Hotspots are point data, derived from (a growing number of) satellite-born instruments that detect light in the thermal wavelengths. Typically, the satellite data are processed with a specific algorithm that highlights areas, or hotspots, with an unusually high temperature.
Why can’t I see this fire on the Digital Earth Australia Hotspots system?- Polar Orbiting satellites used by DEA Hotspots only look over the fire ground up to four times per day and was not designed to provide ‘live’ updates on fire fronts (this includes the MODIS (Aqua and Terra), Suomi NPP (VIIRS) and NOAA (AVHRR));
- Optical satellite imagery does not see through clouds, heavy smoke or tree canopy and can obscure fires;
- Fires may be missed if they are quite small or they do not cover a spatial footprint large enough to be detected by the sensor;
- Satellite-derived hotspots are unlikely to detect cool fires;
- Sensors can be inoperable for extended periods of time and as a result, hotspots are not derived during this time;
- No satellite was looking over the fire ground when the fire was burning;
- Hotspots are potential bushfires, but could also indicate other phenomena, such as black soils, gas fires, heavy industry, smoke plumes, hot rocks or jet contrails.
The Digital Earth Australia Hotspots UI provides users with the ability to visualise, search and download current and historic Hotspot data for any particular location Australia-wide. Users are able to overlay satellite passes, mosaics, topography, burnt areas, and other imagery sources such as ASTER, Landsat, Near Real-time, fractional cover and Barest earth.
How often are hotspots detected from satellites?At best, hotspots information is 17 minutes old (this is how long it takes to download and process data into hotspots after each satellite pass). The Himawari-9 satellite is a geostationary satellite, which covers Australia at all times, and provides updates every 10 minutes, however the information is not published in real time. All other satellites pass over a given area up to 4 times a day, and each pass covers only a part of Australia, which means some fires are not detected because the satellite was not looking over that area at the appropriate time.
To obtain more information about orbital tracks of the latest Terra, Aqua, Suomi NPP and NOAA passes over Australia, visit the following websites:
- SSEC Terra Orbit Prediction
- SSEC Aqua Orbit Prediction
- SSEC NPP Orbit Prediction
- SSEC NOAA-19 Orbit Prediction
Digital Earth Australia Hotspots is a continental scale project crossing several time zones and uses Coordinated Universal Time (UTC) to display and archive Hotspot data generated from different satellite sources.
Use the following conversion table to convert UTC to your own local time zone.
| Local time zone | Conversion from UTC | Time at 12:00 UTC |
|---|---|---|
| AEST - Eastern Standard Time | +10 hours | 10:00 pm |
| AEDT - Eastern Daylight Savings | +11 hours | 11:00 pm |
| ACST - Central Standard Time | +9.5 hours | 9:30 pm |
| ACDT - Central Daylight Savings | +10.5 hours | 10:30 pm |
| AWST - Western Standard Time | +8 hours | 8:00 pm |
| AWDT - Western Daylight Savings | +9 hours | 9:00 pm |
A full description of hotspots attributes and how the hotspots are generated can be found on the DEA Hotspots Product Definition Document. Hotspots have been archived since August 2002 and contains over 30 million records.
What are some caveats and known problems?- Hotspots are not an accurate measure for the size or location of the fire;
- Hotspots are potential bushfires, but could also indicate other phenomena, such as gas fires, heavy industry and jet contrails;
- Digital Earth Australia Hotspots is not designed to be used in isolation of other data sources and it is not accurate enough to be relied upon for time critical detection and location of fires;
- Hotspots may not be captured and produced if associated imagery is missing;
- Algorithms to detect hotspots from imagery are often updated
At times, the AVHRR sensor on the NOAA satellites will register a line of false hotspots which follow the path of the satellite pass. Usually, these can be seen moving from south-east to north-west along the edge of the sensor image and should be disregarded as potential hotspots.
Where can I access the datasets?You can access the entire dataset or subsets of the data through the web user interface, as web services, or as a direct download through https://hotspots.dea.ga.gov.au/files
Who can I contact for more information?Client services (clientservices@ga.gov.au) through Geoscience Australia.
Layers
The Layers panel allows you to control all the layers on the map including the base map. You can also utilise custom layers from local and remote sources.
Select a Layer Type

- Base Layers: Expand to select an alternate base map.
- All Layers: Expand to select layers to add to the map.
- Custom Layers: Expand to add custom layers from local or remote sources to the map.
Select a Base Map

- Base Layers: Expand to select an alternate base map.
- Layer Name: Expand change base map.
- Feature: Select to toggle map features.
- Opacity: Move slider to change the layer opacity.
Select a Layer

- All Layers: Expand to select layers to add to the map.
- Layer search: Enter text and select the search button to find a relevant layer.
Selecting the three dots lets you choose a quick filter:- Active Layers: Displays all layers currently added to the map.
- All Layers: Clears filters and displays all layers.
- Remove Active Layers: Removes all layers added to the map.
- Layer Name: Expand to display layer properties.
- About: Displays a description of the layer.
- Legend: Displays a legend for the layer.
- Filter: Displays possible filters of layer features.
- Fit Extent: Zooms the map to the layer's extent.
- Remove/Add to Map: Removes or adds the layer to the map.
- Opacity: Move the slider to change the opaqueness of the layer.
The below are filters specific to the Hotspots layer, more details can be found in the product description.
- AHI: Advanced Himawari Imager (AHI) algorithms.
- AVHRR: Advanced Very High Resolution Radiometer (AVHRR) algorithms.
- MODIS: Moderate Resolution Imaging Spectroradiometer (MODIS) algorithms.
- VIIRS: Visible Infrared Imaging Radiometer Suite (VIIRS) algorithms.
- Confidence: Indication of the quality of individual fire pixels within the fire mask, only if available.
- Temperature (Kelvin): Temperature of the hotspot, only if available.
- Power (MW): Estimate of the Fire Radiated Power (FRP) of the Hotspot pixel in Megawatts (MW), only if available.
- Acquired Time: Time that the Hotspot was acquired.
- Layer Group: Expand to see layer group members.
Select a Local Custom Layer

- Expand to add local data.
- Links to GA's layer services.
- File type - Keyhole Markup Language (KML).
- Select "Choose File" to choose a local KML file and add one or more of its layers to the map.
Select a Remote Custom Layer

- Expand to add remote web data.
- Links to GA's layer services.
- Select a Service type:
- Esri ArcGIS Map Server
- Web Map Service (WMS)
- Web Map Tile Service (WMTS)
- Keyhole Markup Language (KML)
- Input a layer URL and select search to see a layer or list of layers to add to the map.
Notifications
For subscribing to our Digital Earth Australia Hotspots Notification Service, we will notify you when we publish or update information about the Hotspots that we monitor.

- RSS reader: Link to download RSS (Really Simple Syndication) XML
- GeoRSS reader: Link to download GeoRSS XML
- KML reader: Link to download Keyhole markup Language (KML) XML
- Recent Hotspots GeoJSON: Link to download recent hotspots in GeoJSON format
Analytics
A list of tools to assist in exploring Hotspot data.

- Inspection Tool: The Inspection Tool is an interactive tool to view feature information and pixel values of active layers.
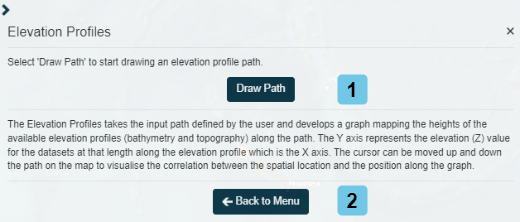
- Elevation Profiles: The Elevation Profile tool creates a cross-section of bathymetry and/or topography along a user defined transact. The Y axis represents the elevation (Z) value for the datasets at that length along the elevation profile which is the X axis. The cursor can be moved up and down the path on the map to visualise the correlation between the spatial location and the position along the graph.
- Measurement Tool The Measurement Tool measures the distance between two or more points on the map.
- Hotspot Time Lapse The Hotspots Time Lapse Tool animates hotspots over an area of interest.
Inspection Tool

- Select a hotspot on the map to view its attributes.
- Hotspot attributes: More details can be found in the product description.
- Select the three dots to show or hide the extended hotspot attributes.
- Back to Menu: Return to the previous menu to choose another tool.
Elevation Profiles
Draw

- Draw Path: Select to draw a path on the map which will generate an elevation profile of the path.
- Click once on map to begin a path.
- Move the pointer and click again to add a leg to the path.
- Double clicking anytime after the first click will submit the path and an elevation profile will be created.
- Back to Menu: Return to the previous menu to choose another tool.
Profile pop up

- Path: Drawing of the elevation profile, the drop pin indicates the location on the map corresponding to the elevation profile.
- Elevation profile: Graph of the elevations for the drawn path.
- Profile details of the pointer position:
- Terrain Elevation (m)
- Slope (%)
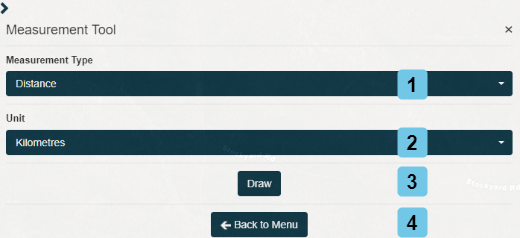
Measurement Tool
Pre-drawing

- Measurement Type: Select to measure area or distance.
- Unit: Select a unit to calculate distance in.
- Draw: Select and add points to the map, double clicking after the first click will complete the drawing.
- Back to Menu: Return to the previous menu to choose another tool.
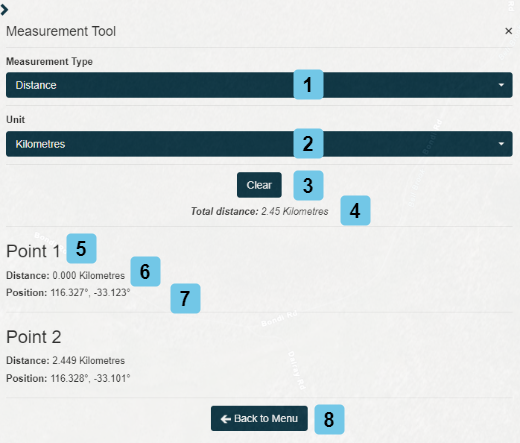
Post-drawing

- Measurement Type: Select area or distance.
- Unit: Select a unit to calculate distance.
- Clear: Remove the current drawing and calculations.
- Total: Calculation based on drawing.
- Way Point: Leg for calculation.
- Distance: From the previous point using the selected units.
- Position: Expressed as longitude and latitude.
- Back to Menu: Return to the previous menu to choose another tool.
Hotspot Time Lapse

- Date Range: Absolute date range to filter hotspots.
- Drawing style choice:
- Box
- Circle
- Polygon
- Freehand
- Draw: Select to draw an extent to filter on. This filter is mandatory.
- Source: Expand to filter hotspots based on their satellite source.
- Attribute: Expand to filter hotspots based on:
- Temperature (°K)
- Power (MW)
- Confidence (%)
- Clear: Remove the current drawing and search result.
- Start: Once an extent has been drawn, a search can be submitted and results will be displayed below.
- Back to Menu: Return to the previous menu to choose another tool.
Hotspot Time Lapse - Source
Hotspots can be filter based on their respective satellite source processing algorithm. More details can be found in the product description.

- AHI: Advanced Himawari Imager (AHI) algorithms.
- AVHRR: Advanced Very High Resolution Radiometer (AVHRR) algorithms.
- MODIS: Moderate Resolution Imaging Spectroradiometer (MODIS) algorithms.
- VIIRS: Visible Infrared Imaging Radiometer Suite (VIIRS) algorithms.
Hotspot Time Lapse - Attribute
Hotspots can be filtered by particular attributes.

- Temperature (Kelvin): Temperature of the hotspot, only if available.
- Power (MW): Estimate of the Fire Radiated Power (FRP) of the Hotspot pixel in Megawatts (MW), only if available.
- Confidence: Indication of the quality of individual fire pixels within the fire mask, only if available.
Location Search
Begin typing an address to start the search, clicking on an address or place of interest will zoom the map on that position.

- Location search input.
- Addresses: Address search results.
- Place of Interest: POI search results.
Search
Search for a list of hotspots based on detailed criteria.

- Date Range: Absolute date range to filter hotspots.
- Source: Expand to filter hotspots based on their satellite source processing algorithm.
- AHI: Advanced Himawari Imager (AHI) algorithms.
- AVHRR: Advanced Very High Resolution Radiometer (AVHRR) algorithms.
- MODIS: Moderate Resolution Imaging Spectroradiometer (MODIS) algorithms.
- VIIRS: Visible Infrared Imaging Radiometer Suite (VIIRS) algorithms.
- Attribute: Expand to filter hotspots based on temperature, power and/or confidence.
- Temperature (°K)
- Power (MW)
- Confidence (%)
- Move slider to adjust filters.
- State: Select a State to filter on.
- Results Per Page: Select the number of results to display per page.
- Drawing style choice:
- Box
- Circle
- Polygon
- Freehand
- Draw: Select to draw an extent on the map to filter on.
- Clear: Reset search criteria to default.
- Search: Submit search using current criteria.


